
UK Furniture E-commerce Brand
Challenge
A UK-based furniture retailer selling through Shopify, Amazon, and its own website had strong sales but unclear profitability. Reporting focused on revenue only, while product margins, discount impact, and channel efficiency were hidden across multiple spreadsheets.
Solution
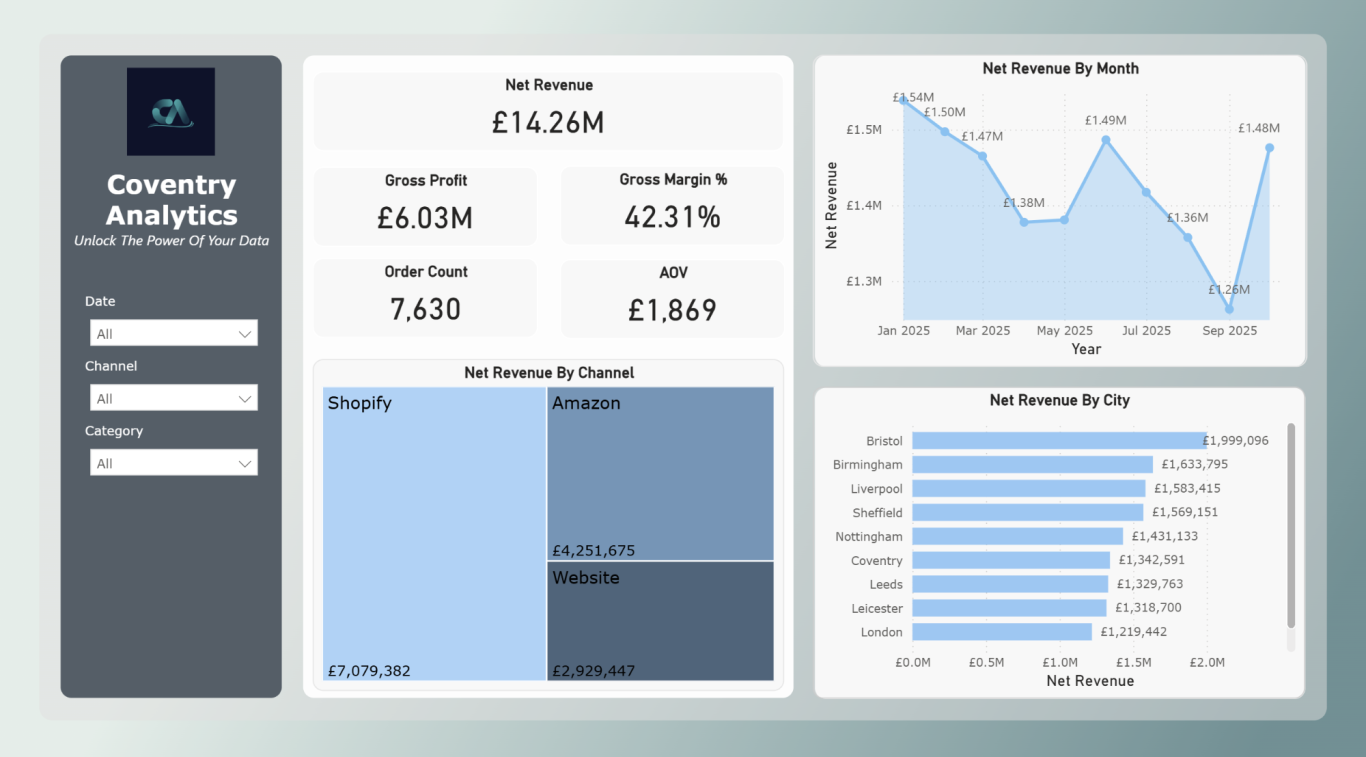
Coventry Analytics delivered a one-page Power BI dashboard showing:
- Net revenue (YTD)
- Gross profit and margin
- Order volume and AOV
- Revenue trends by month
- Profitability by channel and product
The dashboard refreshed automatically and became the single source of truth for weekly trading decisions.
Outcome
- Identified unprofitable high-volume products and adjusted pricing
- Reallocated marketing spend to higher-margin channels
- Increased gross profit by 12% within three months
- Reduced reporting time from hours to minutes