
Inventory & Replenishment Optimisation
Challenge
The business lacked a clear, reliable view of inventory health. Stock levels were tracked across spreadsheets, making it difficult to understand true availability, consumption rate, and replenishment urgency. As a result, purchasing decisions were reactive, stock depletion went unnoticed until late, and multiple SKUs were at risk of stockout despite ongoing replenishment.
Solution
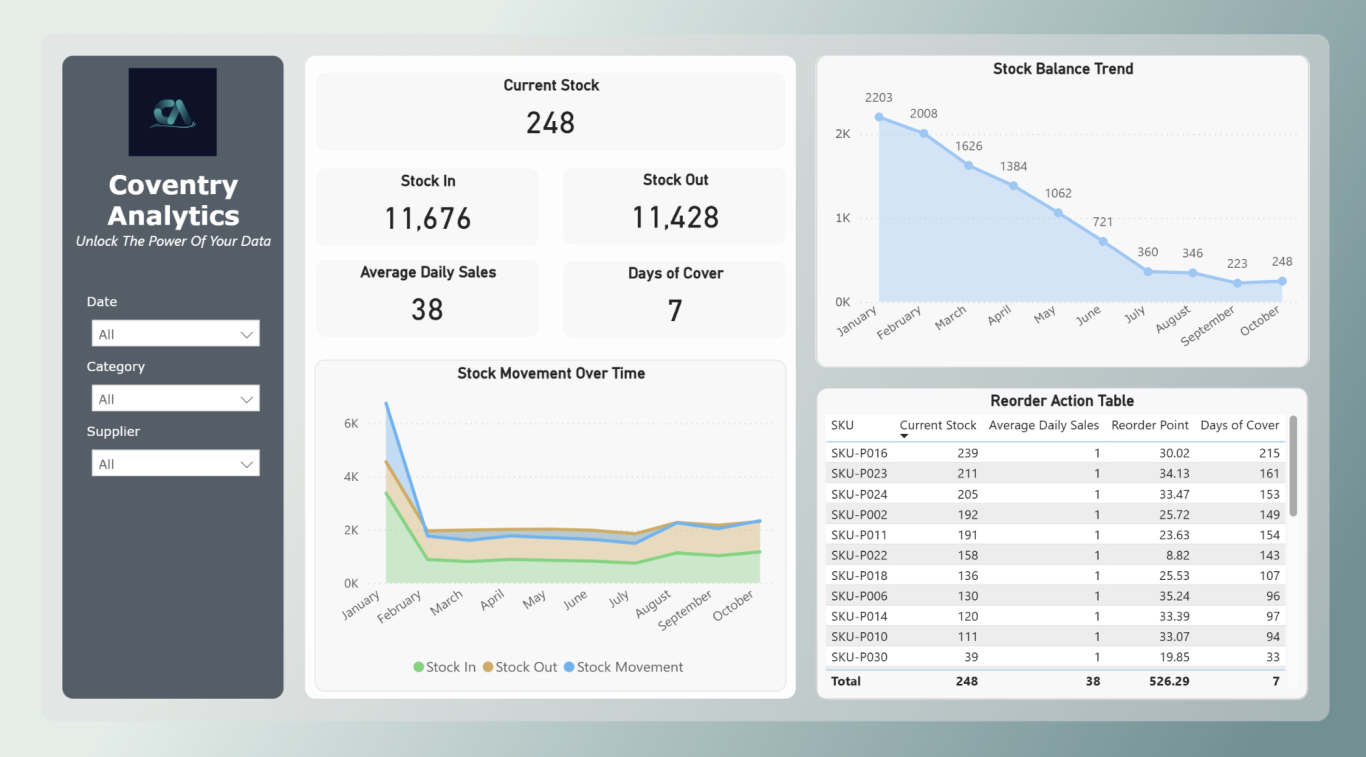
Coventry Analytics implemented a single-page Power BI Inventory & Stock Health Dashboard, built directly from transaction-level stock data.
The dashboard provided real-time visibility into:
- Current Stock calculated from all historical stock movements
- Stock In and Stock Out to clearly separate replenishment from demand
- Average Daily Sales to quantify true consumption rate
- Days of Cover to show how long stock would last at current demand
- Stock Balance Trend to identify sustained depletion patterns
- A Reorder Action Table highlighting SKUs approaching or breaching reorder thresholds
All metrics refreshed automatically and were aligned to operational reality, not manual adjustments.
Outcome
The business gained immediate visibility into stock risk and consumption trends, enabling faster and more confident replenishment decisions. Critical SKUs were identified earlier, purchasing was prioritised based on real demand, and inventory reviews shifted from manual checks to a structured, data-driven process. The dashboard became the core tool for weekly stock planning and ongoing inventory control.